
Try It Yourself#
Exercise 1#
Intervals of increase/decrease
Let \(f(x) = 2x^3 - 18x^2 + 48x\). Find the intervals where \(f\) is increasing.
Show answer
Answer: \((-\infty,2)\) and \((4,\infty)\)
Exercise 2#
Relative extrema
Find the relative extrema of the function \(g(x) = x^4-8x^3+22\).
Show answer
Answer: relative minimum at \(x=6\)
Exercise 3#
Critical points
Find the \(x\)-coordinate for each critical point of \(f(x) = \dfrac{32}{x} + 8x^2\), if any.
Show answer
Answer: \(x = \sqrt[3]{2}\)
Exercise 4#
Critical points
Find the \(x\)-coordinate for each critical point of \(f(x) = x^{3/2} + \dfrac{12}{\sqrt{x}} + 8\), if any.
Show answer
Answer: \(x = 2\)
Exercise 5#
Concavity
If \(f''(x) = 7x^2 + \dfrac{56}{x}\), find the intervals where \(f\) is concave down.
Show answer
Answer: \((-2,0)\)
Exercise 6#
Concavity
If \(f''(x) = \dfrac{x^2+x-6}{x-1}\), find the intervals where \(f\) is concave up.
Show answer
Answer: \((-3,1)\) and \((2,\infty)\)
Exercise 7#
Point of diminishing or increasing returns
The total monthly revenue \(R(x)\) generated from sales of Dr. Hager’s Great Lectures of Mathematics DVD series is related to the amount \(x\) spent on advertising by
where \(x\) is in thousands of dollars and \(0\leq x\leq 9\). Determine whether or not \(R(x)\) has a point of increasing or diminishing returns.
Show answer
Answer: \(x=3\) is a point of diminishing returns
Exercise 8#
Asymptotes
Find all vertical and horizontal asymptotes of \( \displaystyle f(x) = \frac{x^5-6x^4-27x^3}{x^6-9x^4}\).
Show answer
Answer: Vertical Asymptotes: \(x=0\) and \(x=3\), Horizontal Asymptote: \(y=0\)
Exercise 9#
Curve sketching
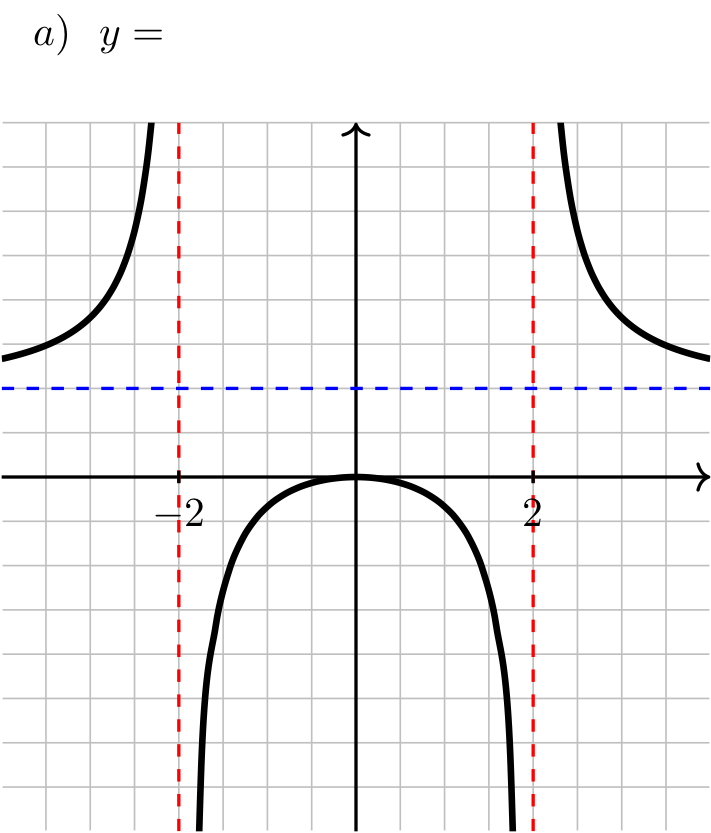
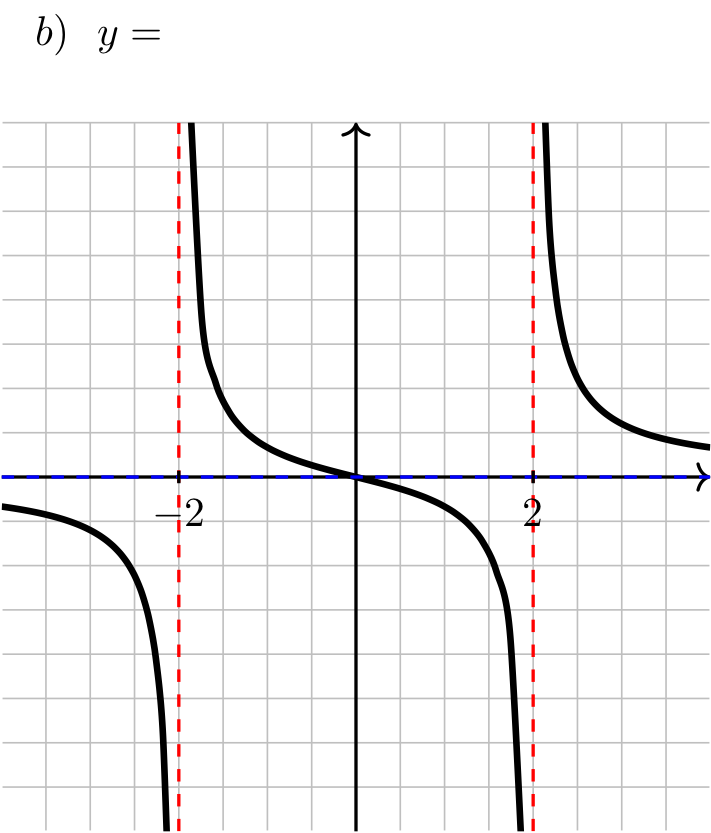
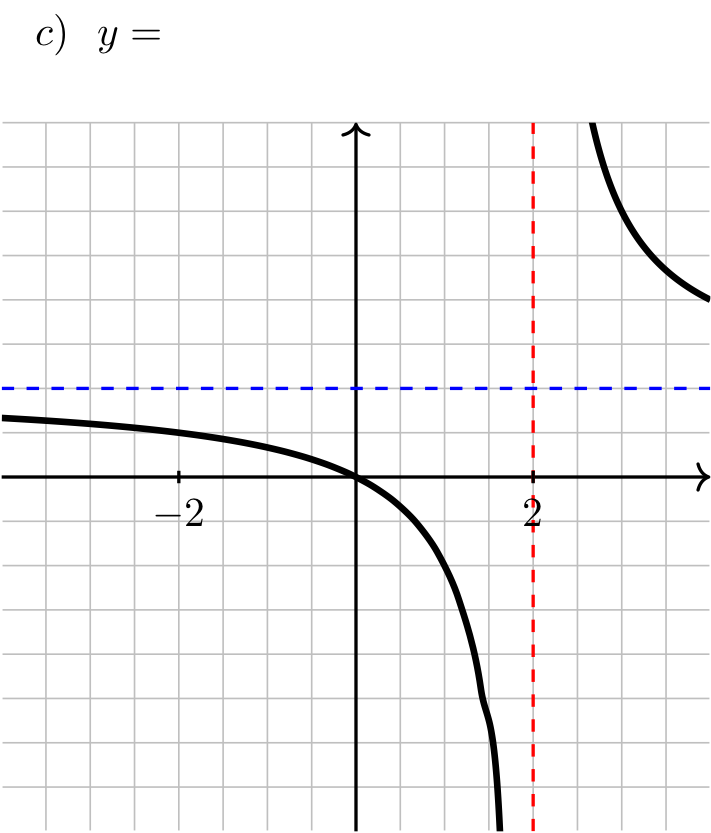
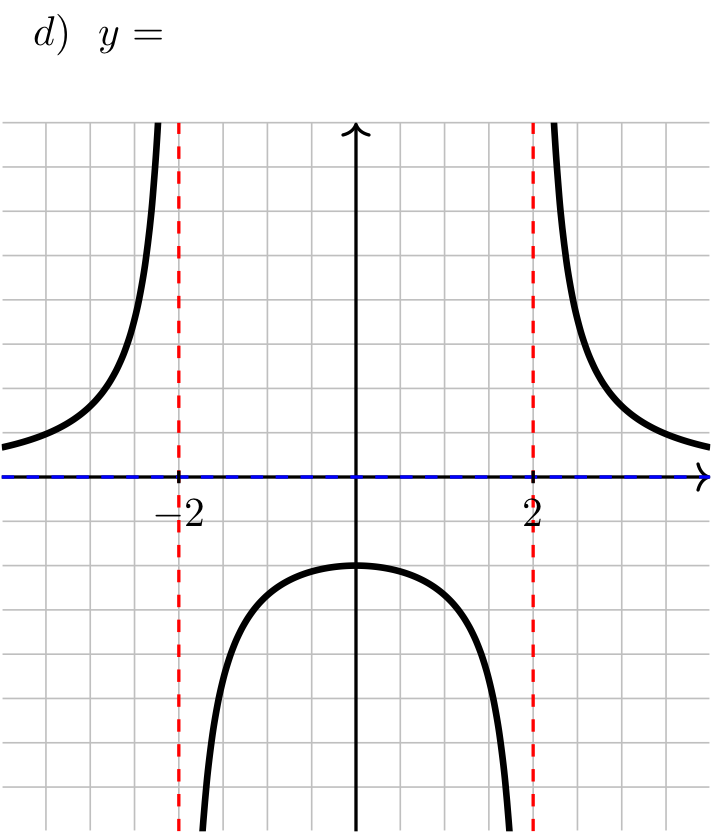
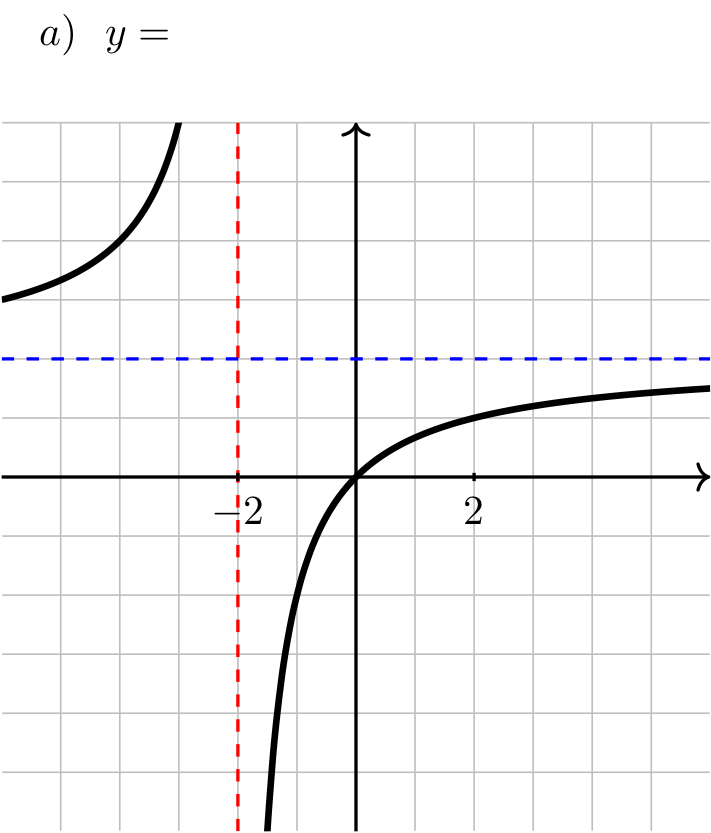
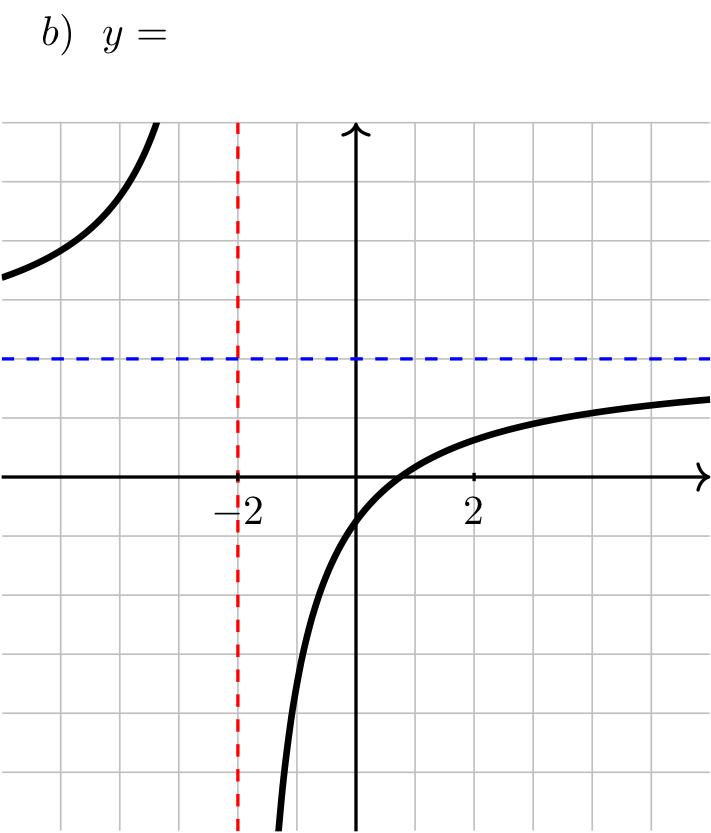
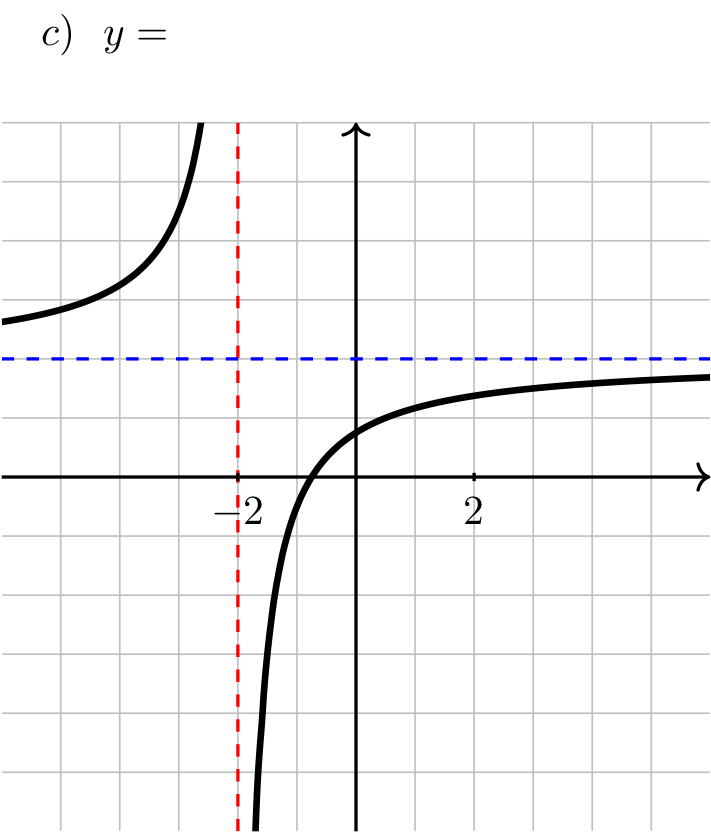
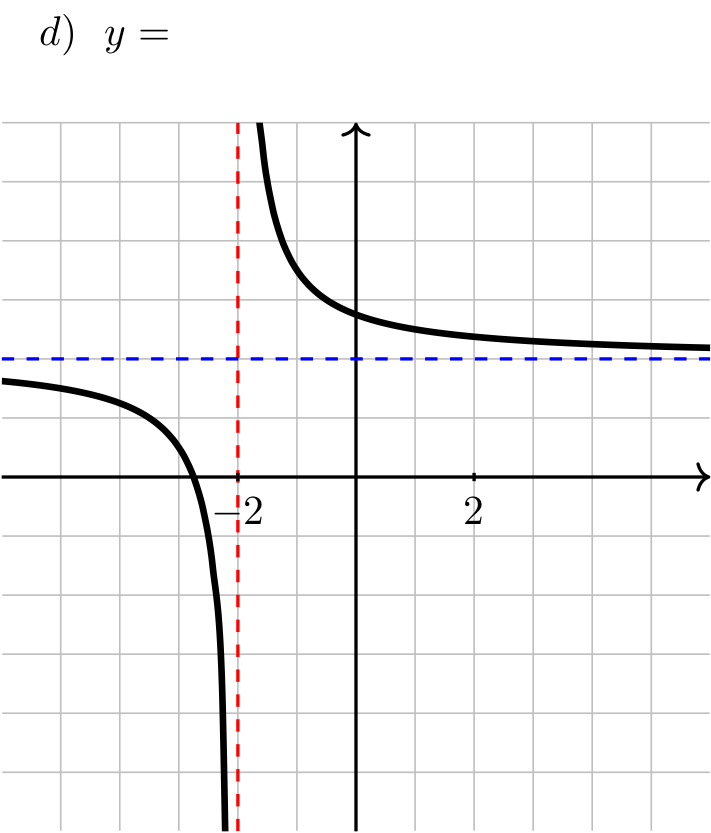
The graph of each of the following functions is displayed below. Label each graph with the corresponding function.
Long Text Description
There are four sets of axes labeled with letters. In each there is a horizontal x-axis with the points -2 and 2 marked. In each there is a vertical y-axis with no points marked. Each has a grid of 1/2 by 1/2 unit cells in the background.
In image (a), there are vertical red dashed lines indicating vertical asymptotes at x = 2 and x = -2; there is a horizontal blue dashed line indicating a horizontal asymptote at y = 1. The graph of a function is plotted on these axes. To the left of x = -2 the function is above the blue line, increasing, and concave up and heads to infinity as it approaches the asymptote; between the asymptotes, the function comes up from negative infinity, stays below the blue dashed line and is concave down, heading to negative infinity as it approaches the asymptote. To the right of its asymptotes, the function comes down from positive infinity, is decreasing, concave up, and above the blue line.
In image (b), there are vertical red dashed lines indicating vertical asymptotes at x = 2 and x = -2; there is a horizontal blue dashed line indicating a horizontal asymptote at y = 0. The graph of a function is plotted on these axes. To the left of x = -2 the function is below the blue line, decreasing, and concave down and heads to negative infinity as it approaches the asymptote; between the asymptotes, the function comes down from infinity, decreases, crosses the blue line, and heads to negative infinity as it approaches the asymptote. To the right of its asymptotes, the function comes down from positive infinity, is decreasing, concave up, and above the blue line.
In image (c), is a vertical red dashed line indicating a vertical asymptote at x = 2; there is a horizontal blue dashed line indicating a horizontal asymptote at y = 1. The graph of a function is plotted on these axes. To the left of x = 2 the function is below the blue line, decreasing, and concave down, and heads to negative infinity as it approaches the asymptote. To the right of its asymptote, the function comes down from positive infinity, is decreasing, concave up, and above the blue line.
In image (d), there are vertical red dashed lines indicating vertical asymptotes at x = 2 and x = -2; there is a horizontal blue dashed line indicating a horizontal asymptote at y = 0. The graph of a function is plotted on these axes. To the left of x = -2 the function is above the blue line, increasing, and concave up and heads to infinity as it approaches the asymptote; between the asymptotes, the function comes up from negative infinity, stays below the blue dashed line and is concave down, heading to negative infinity as it approaches the asymptote. To the right of its asymptotes, the function comes down from positive infinity, is decreasing, concave up, and above the blue line.
Show answer
Answer: a) \(\dfrac{x^2}{x^2-4} \quad\) b) \(\dfrac{x}{x^2-4} \quad\) c) \(\dfrac{x}{x-2} \quad\) d) \(\dfrac{4}{x^2-4}\)
Exercise 10#
Curve sketching
The graph of each of the following functions is displayed below. Label each graph with the corresponding function.
Long Text Description
There are four sets of axes labeled with letters. In each there is a horizontal x-axis with the points -2 and 2 marked. In each there is a vertical y-axis with no points marked. Each has a grid of 1 by 1 unit cells in the background. The graphs of four functions are plotted, one on each acis.
In all four images, there is a vertical red dashed line indicating a vertical asymptote at x = -2, there is a horizontal blue dashed line indicating a horizontal asymptote at y = 2.
In image (a), the function comes in from the left increasing from the blue line and concave up, and heads towards positive infinity as x approaches -2 from the left, then comes up from negative infinity to the right of x = -2, increases, passes through the origin, and is concave down, heading up towards the blue line from below.
In image (b), the function comes in from the left increasing from the blue line and concave up, and heads towards positive infinity as x approaches -2 from the left, then comes up from negative infinity to the right of x = -2, increases, passes through the y-axis just below the origin, and is concave down, heading up towards the blue line from below.
In image (c), the function comes in from the left increasing from the blue line and concave up, and heads towards positive infinity as x approaches -2 from the left, then comes up from negative infinity to the right of x = -2, increases, passes through the y-axis just above the origin, and is concave down, heading up towards the blue line from below.
In image (d), the function comes in from the left decreasing from the blue line and concave down, and heads towards negative infinity as x approaches -2 from the left, then comes down from positive infinity to the right of x = -2, decreases and is concave up, heading down towards the blue line from above.
Show answer
Answer: a) \(\frac{4x}{2x+4} \quad\) b) \(\frac{4x-3}{2x+4} \quad\) c) \(\frac{4x+3}{2x+4} \quad\) d) \(\frac{4x+11}{2x+4}\)
Exercise 11#
Curve sketching
Consider the function
Determine the following information regarding \(f(x)\) and use it to sketch its graph.
a) Domain
b) Intercepts
c) Asymptotes
d) Intervals of Increase/Decrease
e) Relative Extrema
f) Intervals of Concavity
g) Inflection Points
Show answer
Answer: a) \((-\infty,-3)\cup(-3,3)\cup(3,\infty)\)
b) \((-2,0)\), \((2,0)\), and \((0,4/9)\)
c) Vertical Asymptotes: \(x=-3\) and \(x=3\), Horizontal Asymptote: \(y=1\)
d) Increasing on \((-\infty,-3)\) and \((-3,0)\), Decreasing on \((0,3)\) and \((3,\infty)\)
e) Relative maximum at \(x=0\)
f) Concave up on \((-\infty,-3)\) and \((3,\infty)\), Concave down on \((-3,3)\)
g) No inflection points
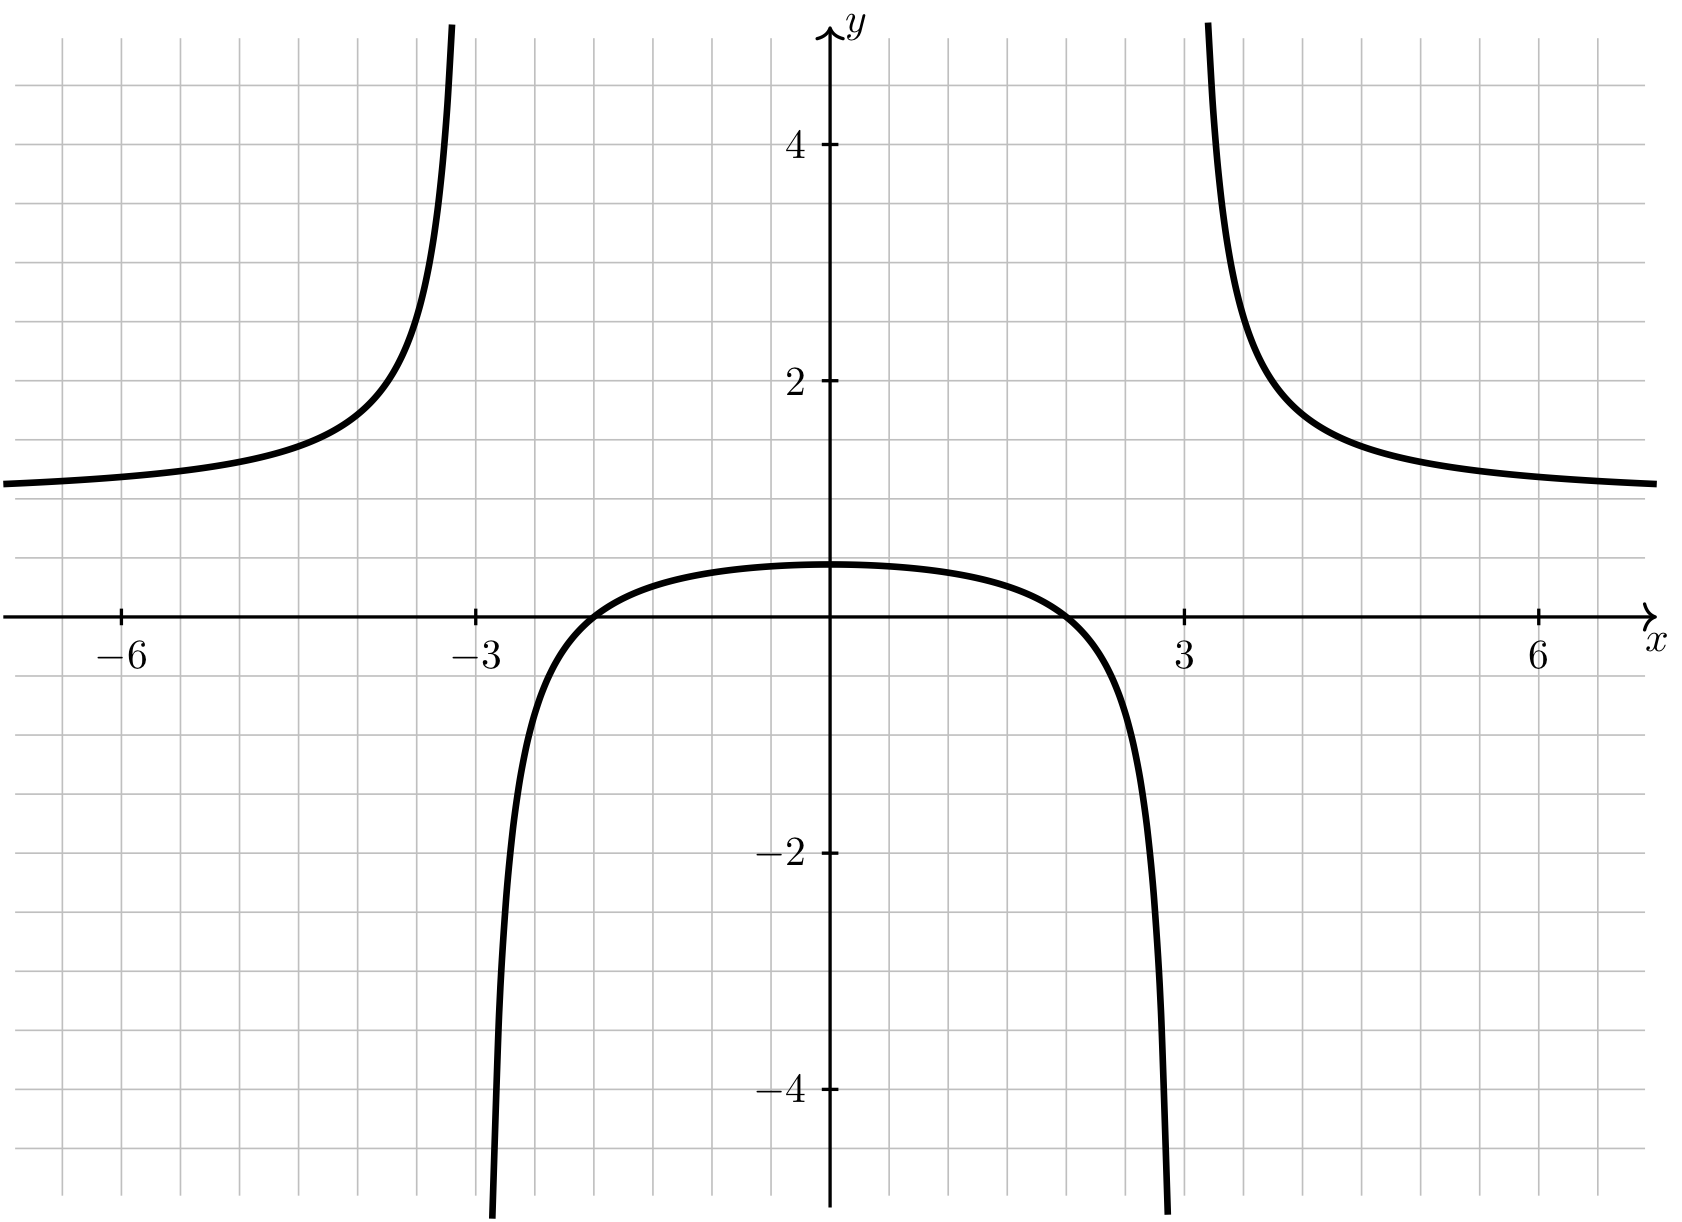
Long Text Description
There is a horizontal x-axis with the points -6, -3, 3, and 6 labeled. There is a vertical y-axis with the points -4, -2, 2, and 4 labeled. There is a curve plotted on these axes with vertical asymptotes at x = -3 and x = 3, and a horizontal asymptote at y = 1. The curve is in three components, the leftmost is increasing and concave up, increasing from its horizontal asymptote from the left and heading upwards to infinity and the vertical asymptote x=-3. The central component is concave down, increases from negative infinity at x=-3, achieves a maximum at x=0, and decreases back to negative infinity as x goes to 3. The rightmost component is concave up and decreases from infinity at x=3 towards its horizontal asymptote as it goes off to the right.