
Intervals of Increase & Decrease#
Definitions#
Definition
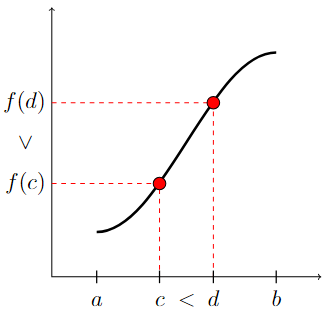
A function \(f\) is increasing on the interval \((a,b)\) if for any two numbers \(c\) and \(d\) in \((a,b)\), \(f(c) < f(d)\) whenever \(c<d\).
In other words, the graph of the function goes up from left to right on the interval \((a,b)\), as illustrated below.
Long Text Description
There is a horizontal axis with the points a, c, d, and b marked. It is noted that c is less than d. There is a vertical axis with the points f(c) and f(d) marked. It is noted that f(c) is less than f(d). The graph of the function f is plotted on these axes and the points (c,f(c)) and (d,f(d)) are each indicated by a red filled-in circle on the graph. The value of the function goes up as it goes from left to right. There is a red dashed line going from the point (c,0) to (c,f(c)) and then continuing to (0,f(c)). There is another red dashed line going from the point (d,0) to (d,f(d)) and then continuing to (0,f(d)).
Definition
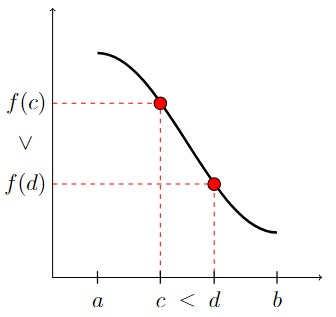
A function \(f\) is decreasing on the interval \((a,b)\) if for any two numbers \(c\) and \(d\) in \((a,b)\), \(f(c) > f(d)\) whenever \(c<d\).
In other words, the graph of the function goes down from left to right on the interval \((a,b)\), as illustrated below.
Long Text Description
There is a horizontal axis with the points a, c, d, and b marked. It is noted that c is less than d. There is a vertical axis with the points f(d) and f(c) marked. It is noted that f(c) is more than f(d). The graph of the function f is plotted on these axes and the points (c,f(c)) and (d,f(d)) are each indicated by a red filled-in circle on the graph. The value of the function goes down as it goes from left to right. There is a red dashed line going from the point (c,0) to (c,f(c)) and then continuing to (0,f(c)). There is another red dashed line going from the point (d,0) to (d,f(d)) and then continuing to (0,f(d)).
What the Sign of \(f'\) Tells Us About \(f\)
We can use the derivative to determine if a function is increasing or decreasing on a given interval.
If \(f'(x) > 0\) for all \(x\) in the interval \((a,b)\), then \(f\) is increasing on \((a,b)\).
If \(f'(x) < 0\) for all \(x\) in the interval \((a,b)\), then \(f\) is decreasing on \((a,b)\).
Example 1#
Intervals of increase/decrease from the graph of a function
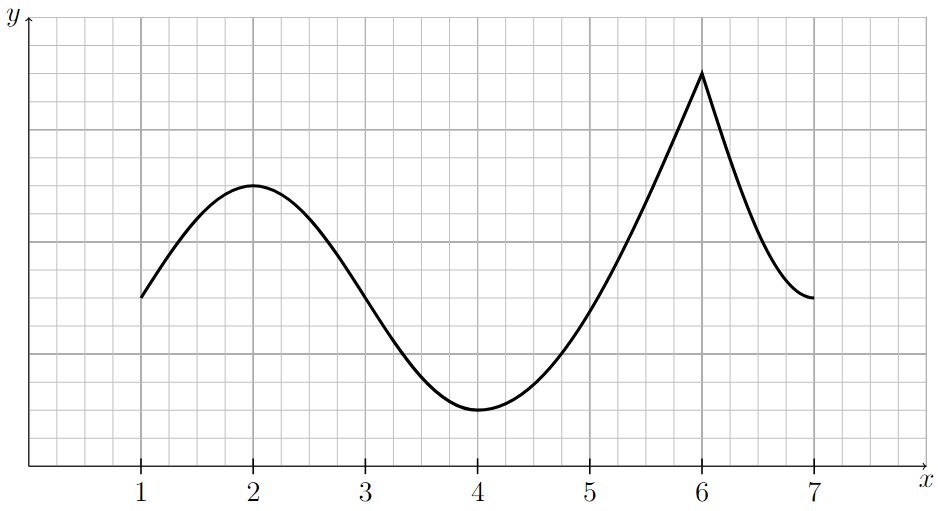
The following is the graph of a continuous function that is increasing on the intervals \((1,2)\) and \((4,6)\) and decreasing on the intervals \((2,4)\) and \((6,7)\).
Long Text Description
There is a horizontal x-axis with the points 1, 2, 3, 4, 5, 6, and 7 marked. There is a vertical y-axis with no points marked. The graph of a function is plotted here. The graph moves consistently upward as it goes from x = 1 to x = 2, moves consistently downward as it goes from x = 2 to x = 4, moves consistently upward as it goes from x = 4 to x = 6, moves consistently downward as it goes from x = 6 to x = 7. The graph has rounded corners at x = 2 and 4, and has a sharp corner at x = 6.
Finding Intervals of Increase/Decrease using the Derivative#
How to Find the Intervals of Increase/Decrease of a Function
Find all values of \(x\) such that \(f'(x) = 0\) or \(f'(x)\) does not exist.
Break up domain of \(f\) into open intervals between values found in Step 1.
Evaluate \(f'(x)\) at one value, \(c\), from each interval, \((a,b)\), found in Step 2.
If \(f'(c) > 0\), then \(f\) is increasing on \((a,b)\).
If \(f'(c) < 0\), then \(f\) is decreasing on \((a,b)\).
Example 2#
Finding intervals of increase/decrease using the graph of the derivative
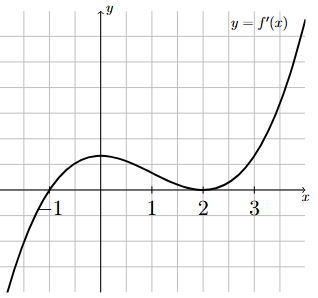
The following graph corresponds to \(f'(x)\), the first derivative of \(f(x)\).
Using the graph of \(f'(x)\), determine the intervals of increase/decrease of \(f(x)\). You may assume that \(f'(x)\) is continuous for all \(x\) and \(f'(x) = 0\) only when \(x = -1\) and \(x = 2\).
Long Text Description
There is a horizontal x-axis with the points -1, 1, 2, and 3 marked. There is a vertical y-axis with no points marked. The graph of a continuous function is plotted here. The graph of the function touches the x-axis at x = -1 and at x = 2. The graph is below the x-axis for x < - 1. The graph is above the x-axis for -1 < x < 2 and for x > 2.
Step 1: Find all values of \(x\) such that \(f'(x) = 0\).
We were given that \(f'(x) = 0\) only when \(x = -1\) and when \(x = 2\).
Step 2: Find all values of \(x\) such that \(f'(x)\) does not exist.
Notice that \(f'(x)\) is defined for all real numbers since we were told that \(f'(x)\) is continuous for all \(x\).
Step 3: Break up the domain of \(f\) into subintervals.
Break up the domain of \(f\) into subintervals based on the values found in Steps 1 and 2.
Since we found \(x=-1\) and \(x=2\) to be the only values where \(f'(x) = 0\) or where \(f'(x)\) is not defined, we break up the domain of \(f\) (which is \((-\infty,\infty)\)) into the following subintervals:
Step 4: Use the graph to determine the sign of \(f'\) on each interval.
\(\mathbf{(-\infty,-1)}\): Since the graph of \(f'(x)\) is below the \(x\)-axis on this interval, \(f'(x) < 0\) for all \(x\) on \((-\infty,-1)\).
\(\mathbf{(-1,2)}\): Since the graph of \(f'(x)\) is above the \(x\)-axis on this interval, \(f'(x) > 0\) for all \(x\) on \((-1,2)\).
\(\mathbf{(2,\infty)}\): Since the graph of \(f'(x)\) is above the \(x\)-axis on this interval, \(f'(x) > 0\) for all \(x\) on \((2,\infty)\).
Step 5: Use the sign of \(f'\) to determine the intervals of increase/decrease of \(f\).
Recall that \(f\) is increasing on intervals where \(f'(x) > 0\) and decreasing on intervals where \(f'(x) < 0\).
Therefore, \(f\) is increasing on \((-1,2) \cup (2,\infty)\) and decreasing on \((-\infty,-1)\).
Example 3#
Finding intervals of increase/decrease
Determine the intervals where \(f(x) = x^3 + 3 x^2 - 9 x -8\) is increasing and where it is decreasing.
Step 1: Compute \(f'(x)\).
Step 2: Find all values of \(x\) such that \(f'(x) = 0\).
which is equal to zero when \(x=-3\) and \(x=1\).
Step 3: Find all values of \(x\) such that \(f'(x)\) does not exist.
Notice that \(f'(x)\) is defined for all real numbers.
Step 4: Break up the domain of \(f\) into subintervals.
Break up the domain of \(f\) into subintervals based on the values found in Steps 2 and 3.
Since we found \(x=-3\) and \(x=1\) to be the only values where \(f'(x)\) could change sign, we break up the domain of \(f\) (which is \((-\infty,\infty)\)) into the following subintervals:
Step 5: Plug one number from each subinterval into \(f'(x)\) to determine the sign of \(f'(x)\) on that interval.
\(\mathbf{(-\infty,-3)}\): Plug \(x=-4\) into \(f'(x)\). Since \(f'(-4) = 3(-1)(-5) > 0\), \(f'(x) > 0 \) for all \(x\) on \((-\infty,-3)\).
\(\mathbf{(-3,1)}\): Plug \(x=0\) into \(f'(x)\). Since \(f'(0) = 3(3)(-1) < 0\), \(f'(x) < 0\) for all \(x\) on \((-3,1)\).
\(\mathbf{(1,\infty)}\): Plug \(x=2\) into \(f'(x)\). Since \(f'(2) = 3(5)(1) > 0\), \(f'(x) > 0\) for all \(x\) on \((1,\infty)\).
Step 6: Use the sign of the derivative to determine the intervals of increase/decrease .
Recall that \(f(x)\) is increasing on intervals where \(f'(x) >0\) and decreasing on intervals where \(f'(x) < 0\).
Therefore, \(f(x)\) is increasing on \((-\infty,-3) \cup (1,\infty)\) and decreasing on \((-3,1)\).
Graphical Representation of Sign Analysis
We will typically represent the above sign analysis by drawing a number line, marking off the values in the domain of \(f\) such that \(f'(x) = 0\) or \(f'(x)\) does not exist, and then putting a \(+\) or \(-\) above each interval according to the sign of \(f'(c)\), where \(c\) is the test value taken from the corresponding interval. The number line associated with the calculations in Example 3 is shown below.
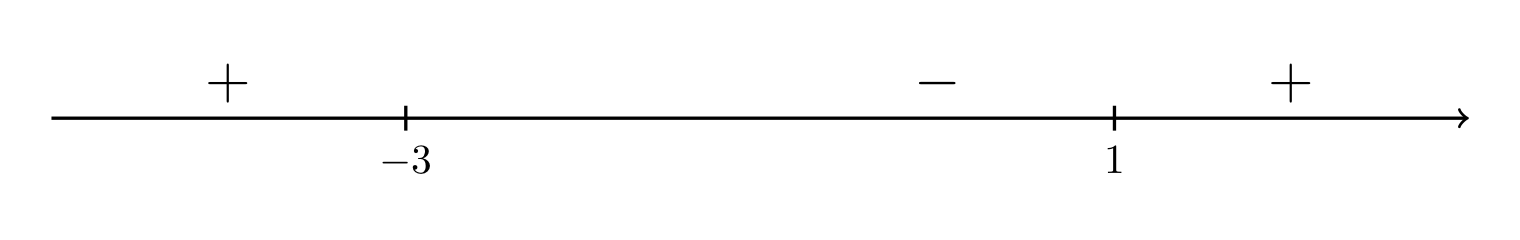
Long Text Description
A number line with positive and negative signs assigned to intervals, with positive to the left of negative three, negative between negative three and one, and positive to the right of one.