
Curve Sketching#
Drawing the graph of \(y=f(x)\)
Determine the domain.
Find the \(x\) and \(y\) intercepts, if any.
Find the vertical and horizontal asymptotes, if any.
Determine the intervals of increase and decrease.
Find the relative extrema, if any.
Determine the intervals of concavity.
Find the inflection points, if any.
Graph some additional points to help identify the shape of \(f\), if needed, and use all of this information to sketch the curve.
Example 1#
Curve sketching
Sketch the graph of \(y = \dfrac{2x + 3}{x + 4}\).
Step 1: Determine the domain.
In this case, \(f(x)= \dfrac{2x + 3}{x + 4}\) is undefined when the denominator equals zero, which is when \(x= -4\). Therefore, the domain of \(f\) is \((-\infty, -4) \cup (-4, \infty)\).
Step 2: Find the \(x\) and \(y\) intercepts, if any.
\(x\)-intercept: Set \(y=0\) and solve for \(x\).
\(y\)-intercept: Set \(x=0\) and solve for \(y\).
Therefore, \(f\) has an \(x\)-intercept at the point \((-3/2,0)\) and a \(y\)-intercept at the point \((0,3/4)\).
Step 3: Find the vertical and horizontal asymptotes, if any.
Vertical Asymptotes: Since the numerator and denominator are already factored, the vertical asymptotes correspond to the values of \(x\) that make the denominator equal to zero. This happens only when \(x = -4\), so \(x = -4\) is the only vertical asymptote.
Horizontal Asymptotes: Since the degree of the numerator and the denominator are the same, both limits at infinity are equal to the ratio of leading coefficients.
\[\lim_{x\to -\infty} \frac{2x + 3}{x + 4} = 2 = \lim_{x\to \infty} \frac{2x + 3}{x + 4}\]Therefore, \(y=2\) is the only horizontal asymptote.
Step 4: Determine the intervals of increase and decrease.
Compute \(f'(x)\).
\[\begin{align*} f'(x) &= \frac{2(x + 4) - (2x + 3)(1)}{(x + 4)^2} && \text{using the quotient rule}\\ &= \frac{2x + 8 - 2x - 3}{(x + 4)^2} && \text{expand the numerator}\\ &= \frac{5}{(x + 4)^2} && \text{combine like terms in numerator} \end{align*}\]Notice that \(f'(x)\) is never equal to zero and is defined for all values of \(x\) in the domain of \(f\) (i.e., \(f\) doesn’t have any critical points).
Compute the sign of \(f'(x)\) on the domain of \(f\).

Long Text Description
A number line with positive and negative signs assigned to intervals, with positive to the left of negative four, and with positive to the right of negative four.
Therefore, \(f\) is increasing on \((-\infty, -4)\) and \((-4, \infty)\).
Step 5: Find the relative extrema, if any.
Since \(f\) does not have any critical points, \(f\) does not have any relative extrema.
Step 6: Determine the intervals of concavity.
Compute \(f''(x)\).
Notice that \(f''(x)\) is never equal to zero and is defined for all values of \(x\) in the domain of \(f\).\
Compute the sign of \(f''(x)\) on the domain of \(f\).
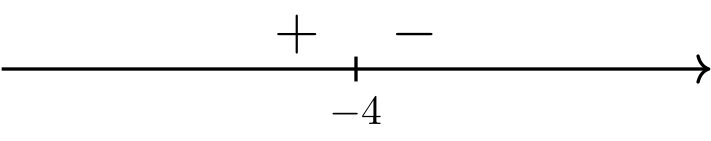
Long Text Description
A number line with positive and negative signs assigned to intervals, with positive to the left of negative four, and negative to the right of negative four.
Therefore, \(f\) is concave up on \((-\infty, -4)\) and concave down on \((-4, \infty)\).
Step 7: Find the inflection points, if any.
The only change in sign of \(f''(x)\) occurs at \(x=-4\). But since \(x=-4\) is not in the domain of \(f\), \(f\) does not have any inflection points.
Step 8: Use the information gathered to sketch the function.
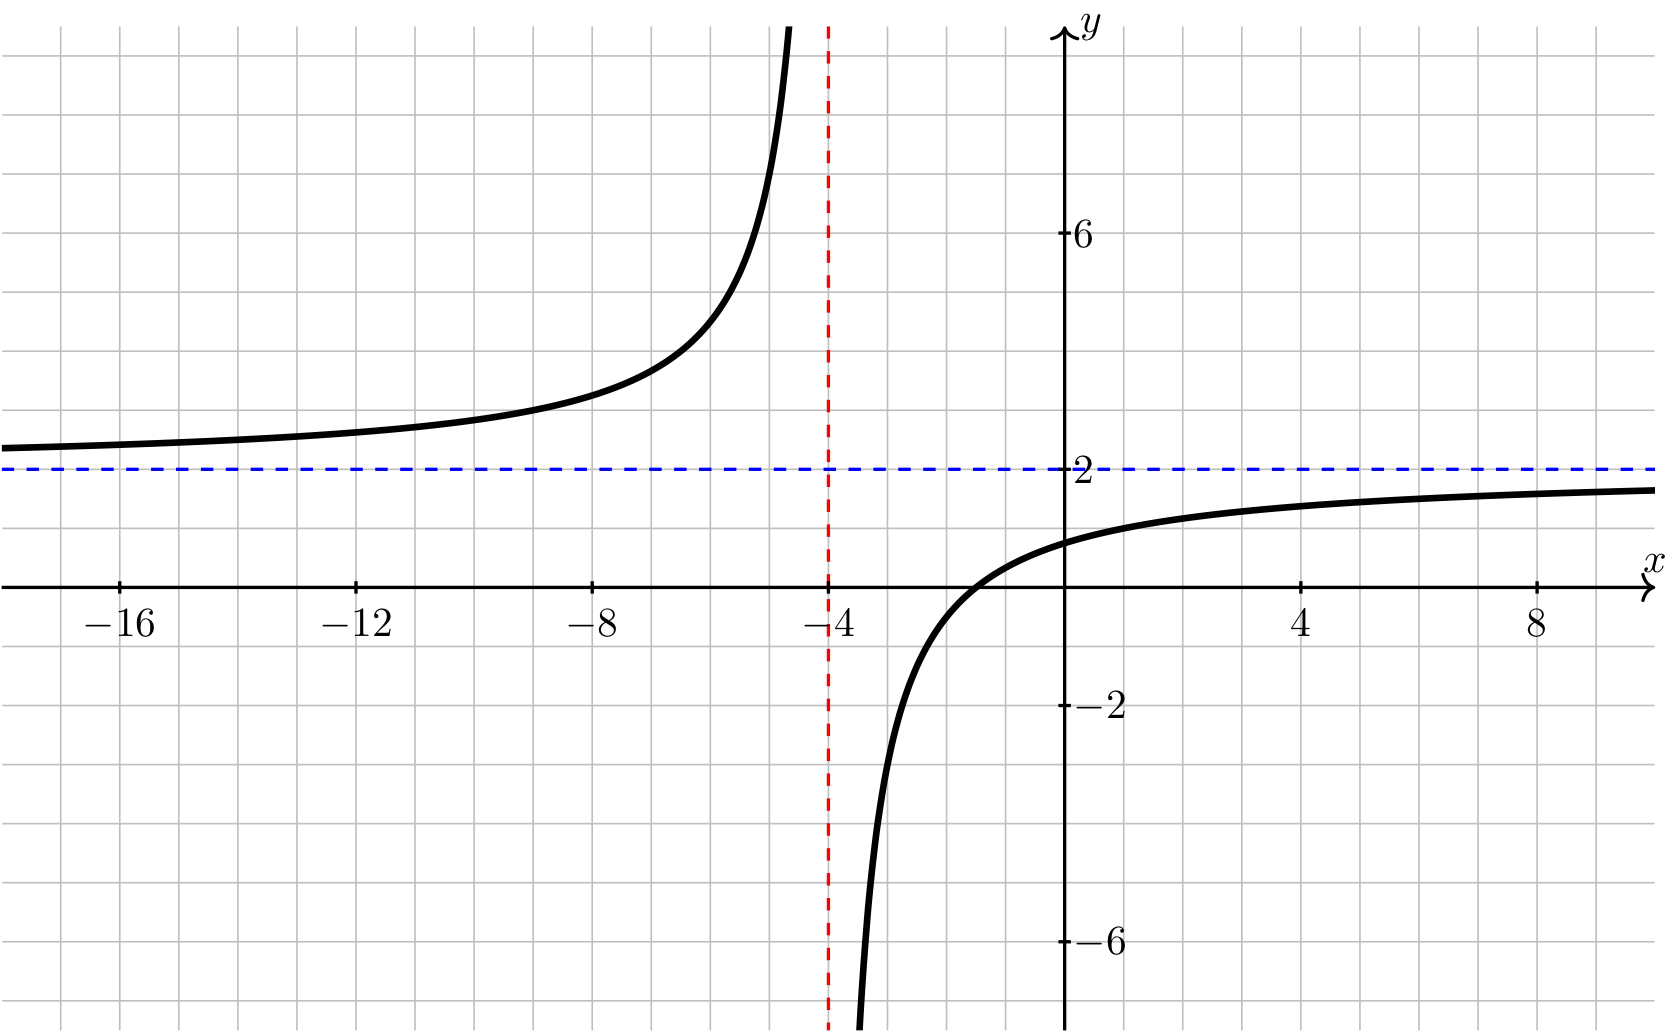
Long Text Description
There is a horizontal x-axis with the points -16, -12, -8, -4, 4, and 8 labeled. There is a vertical y-axis with the points -6, -2, 2, and 6 labeled. A curve is plotted. The curve has a horizontal asymptote represented by a blue dotted line at y=2, and a vertical asymptote represented by a red line at x= -4. The curve comes in increasing and concave up from its horizontal asymptote on the left, then heads towards infinity as x increases to -4. On the other side of x=-4, the curve comes increasing and concave down from negative infinity and increases towards its horizontal asymptote at y=2 as it heads off to the right.