
Demand and Supply#
Definitions#
Definition
Demand refers to the quantity of goods or services that consumers are willing to purchase at a given price.
The Law of Demand
The Law of Demand assumes
all factors affecting purchasing except price are held constant,
if price goes up, then consumers buy less, and
if price goes down, then consumers (are incentivized) to buy more.
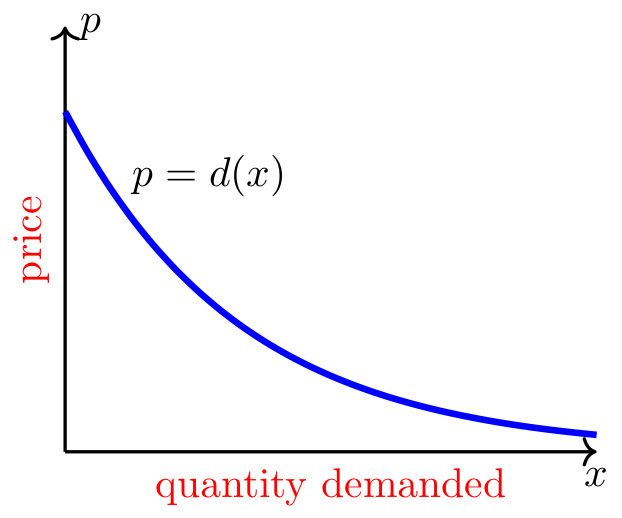
The demand curve, \(p = d(x)\), shows the quantity demanded, \(x\), at each price, \(p\), and the Law of Demand dictates it is a decreasing function.
Long Text Description
There is a horizontal x-axis representing the quantity of a good that is demanded, and a vertical p-axis representing the price of the same good. The image is restricted to the positive side of both axes. There is a blue curve decreasing from left to right representing how much consumers of the good will pay for a given quantity of the good. The curve is labeled p = d(x).
Definition
Supply refers to the amount of goods that producers want to sell at a given price.
The Law of Supply
The Law of Supply assumes
all factors affecting supply except price are held constant,
if price goes up, then suppliers (are incentivized) to produce more, and
if price goes down, then suppliers produce less.
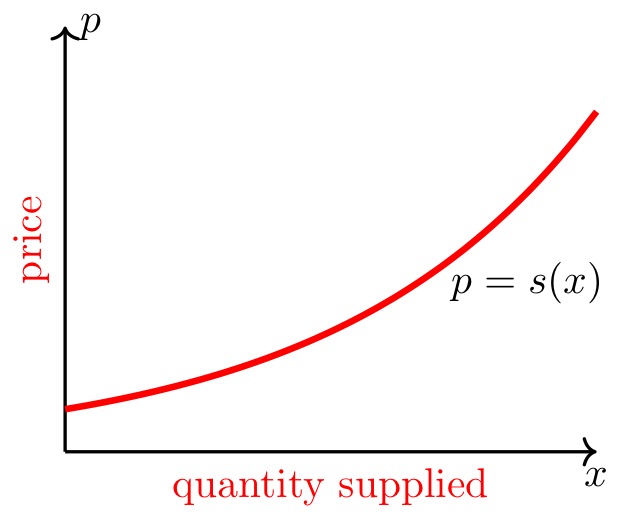
The supply curve, \(p = s(x)\), shows the quantity supplied, \(x\), at each price, \(p\), and the Law of Supply dictates it is an increasing function.
Long Text Description
There is a horizontal x-axis representing the quantity of a good that will be supplied, and a vertical p-axis representing the price of the same good. The image is restricted to the positive side of both axes. There is a red curve increasing from left to right representing the price at which suppliers will sell certain amounts of the good. The curve is labeled p = s(x).
Domain Considerations
For any demand or supply function, the domain should be restricted so that both the quantity \(x\) and price \(p\) are nonnegative (i.e., \(x\geq 0\) and \(p\geq 0\)).
Example 1#
Domain of a demand function
Determine the appropriate domain for the demand function, \(d(x) = 600 - 15x\).
Step 1: Find the values of \(x\geq 0\) such that \(p = d(x) \geq 0\).
Therefore, the domain of the demand function \(d(x) = 600-15x\) is \([0,40]\).
Market Equilibrium#
Definition
A market equilibrium exists when the quantity produced is equal to the quantity demanded.
How to Find the Market Equilibrium
The market equilibrium quantity and price correspond to the point of intersection of the demand and supply curves. To find the equilibirum quantity, set \(d(x) = s(x)\) and solve for \(x\). Then plug that value of \(x\) into \(d(x)\) or \(s(x)\) to find the equilibrium price.
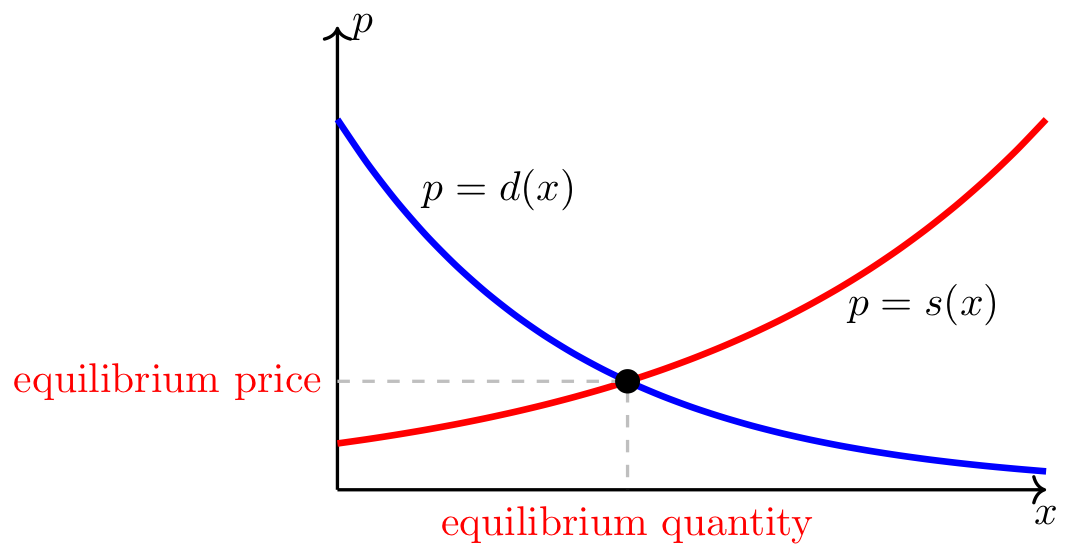
Fig. 3 The market equilibrium is given where demand and supply curves intersect#
Long Text Description
There is a horizontal x-axis representing the quantity of a good, and a vertical p-axis representing the price of the same good. The image is restricted to the positive side of both axes. There is a red curve increasing from left to right representing the price at which suppliers will sell certain amounts of the good. The red curve is labeled p = s(x). There is a blue curve decreasing from left to right representing how much consumers of the good will pay for a given quantity of the good. The blue curve is labeled p = d(x). There is a point where the two curves meet, which is labeled “equilibrium price” along the p-axis and “equilibrium quantity” along the x-axis.
Example 2#
Find the market equilibrium values
The demand and supply functions for Penn State Berkey Creamery Gift Boxes are:
where \(x\) is the number of thousands of boxes and \(p\) is in dollars. Determine the market equilibrium values.
Step 1: Determine the equilibrium quantity.
Since both demand and supply are written as functions of \(x\), we’ll first solve for the equilibrium quantity by setting the two functions equal to each other.
Adding \(x^2+x-72\) to both sides and factoring yields
which is equal to zero when \(x=-8\) or when \(x=5\). But since \(x\) must be nonnegative, the equilibrium quantity corresponds to \(x=5\), which is 5000 boxes.
Step 2: Determine the equilibrium price.
Evaluate demand and supply functions at \(x=5\) to compute the equilibrium price.
Therefore, the equilibrium price is 42 dollars.