
The Second Derivative Test#
Using the Second Derivative to Classify Critical Points#
The Second Derivative Test
Suppose \(c\) is a critical point of \(f\) where \(f'(c) = 0\) and \(f''(x)\) is continuous near \(x=c\).
If \(f''(c) > 0\), then \(f(x)\) has a relative minimum at \(x=c\).
If \(f''(c) < 0\), then \(f(x)\) has a relative maximum at \(x=c\).
If \(f''(c) = 0\), then the test is inconclusive and the First Derivative Test should be used instead.
Example 1#
Classifying critical points using the second derivative test
Find the relative extrema of \(f(x) = 12 x^5 - 45 x^4 - 200 x^3 +12\).
Step 1: Determine the critical points of \(f\).
which equals zero when \(x=-2\), \(x=0\), and \(x=5\). Also note that \(f'\) exists for all \(x\) in the domain of \(f\). Since the domain of \(f\) is \((-\infty,\infty)\), all of these values of \(x\) are critical points.
Step 2: Compute \(f''(x)\).
Step 3: Evaluate \(f''(x)\) at each critical point.
Evaluate \(f''(x)\) at each critical point where \(f'(x)=0\) and use the Second Derivative Test to classify each critical point, if possible.
\(x=-2\): Since \(f'(-2) = 0\) and \(f''(-2) = 60(-2)(16+18-20) < 0\), \(f\) has a relative maximum at \(x=-2\).
\(x=0\): Since \(f'(0) = 0\) and \(f''(0) = 60(0)(-20) = 0\), the Second Derivative test is inconclusive. Instead, using the First Derivative test, we see there is no change in sign of \(f'(x)\) at \(x=0\), and therefore, \(f\) does not have a relative extreme at \(x=0\).
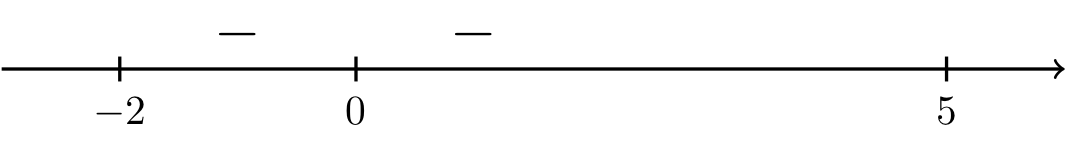
Fig. 6 Interval analysis of \(f''(x) = 60 x (4 x^2 - 9 x - 20)\).#
Long Text Description
A number line with positive and negative signs assigned to intervals, with negative between negative two and zero, and negative between zero and five.
\(x=5\): Since \(f'(5) = 0\) and \(f''(5) = 60(5)(100-45-20) > 0\), \(f\) has a relative minimum at \(x=5\).
Example 2#
Classify critical points based on graph of the second derivative
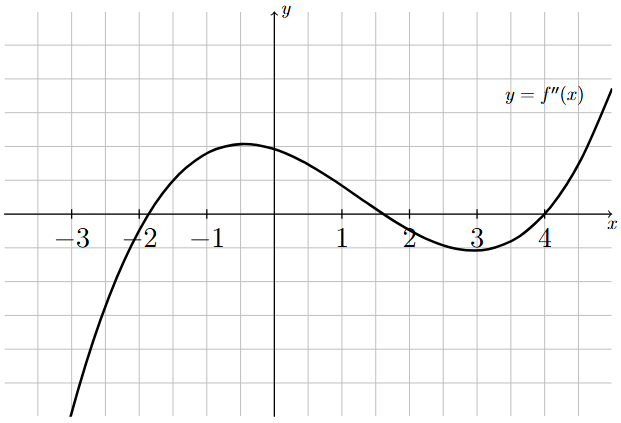
The following graph corresponds to \(f''(x)\), the second derivative of \(f(x)\).
Long Text Description
The graph of the second derivative of a continuous function on the interval (-4,5). The graph of the second derivative is continuous and looks like a cubic polynomial. From left to right, the graph starts below the x-axis and increases until it crosses the x-axis at x = -1.81. It continues to increase, then decreases and crosses the x-axis again at x = 1.61. It continues to decrease, then increases until it crosses the x-axis at x = 4, where the graph increases for all x > 4. The second derivative is negative at x = -3, positive at x = 0, and equal to zero at x = 4.
Classify all critical points of \(f(x)\) using the above graph of \(f''(x)\) and the following information:
\(f'(x) = 0\) only when \(x=-3\), \(x=0\), and \(x=4\),
\(f''(x) = 0\) only when \(x=-1.86\), \(x=1.61\), and \(x=4\),
\(f'(x)\) and \(f''(x)\) are continuous for all \(x\).
Step 1: Determine the critical points of \(f\).
Since \(f'\) is continuous for all \(x\), and therefore defined for all \(x\), the only critical points of \(f\) occur where \(f'(x) = 0\). And we were specifically told that the derivative is equal to zero only when \(x=-3\), \(x=0\), and \(x=4\), so these are the three critical points of \(f\).
Step 2: Classify the critical point at \(x=-3\).
From the given graph of \(f''(x)\), we can see that \(f''(-3)\) is negative. Therefore, since \(f'(-3)=0\) and \(f''(-3) < 0\), by the Second Derivative Test, \(f\) has a relative maximum at \(x = -3\).
Step 3: Classify the critical point at \(x=0\).
From the given graph of \(f''(x)\), we can see that \(f''(0)\) is positive. Therefore, since \(f'(0)=0\) and \(f''(0) > 0\), by the Second Derivative Test, \(f\) has a relative minimum at \(x = 0\).
Step 4: Classify the critical point at \(x=4\).
Since \(f'(4) = 0\) and \(f''(4) = 0\), the Second Derivative Test is inconclusive and we proceed to using the First Derivative Test:
From the graph of \(f''(x)\), note that \(f''(x) < 0\) for \(x\) just before 4 and \(f''(x) > 0\) for \(x\) just after 4.
This means that \(f'(x)\) is decreasing just before \(x=4\) and increasing just after \(x=4\).
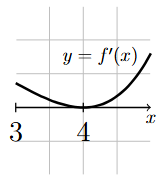
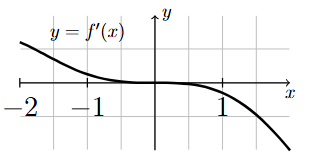
But since \(f'(4) = 0\), \(f'(x)\) must then be positive just before \(x=4\) and positive just after \(x=4\). A graph of \(f'(x)\) is shown below. Notice how \(f'(x)\) is decreasing just before 4 and increasing just after 4.
Long Text Description
A graph of the first derivative of f(x) on the interval [3,5]. The graph starts above the x-axis at x=3, decreases down to the point (4,0) on the x-axis, and then increases on the interval (4,5). The graph of the derivative never crosses the x-axis on the interval shown.
In particular, \(f'(x)\) does not change sign at \(x=4\).
Therefore, by the First Derivative Test, \(f\) does not have a relative extrema at \(x = 4\).
Example 3#
Classify critical points based on graph of the second derivative
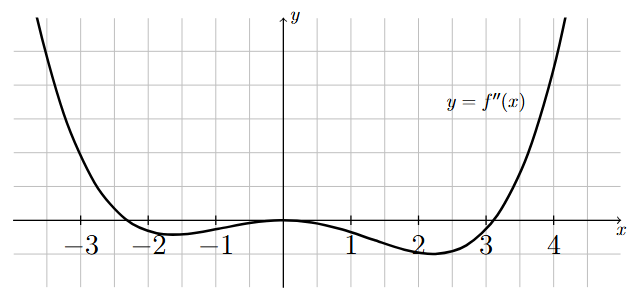
The following graph corresponds to \(f''(x)\), the second derivative of \(f(x)\).
Long Text Description
The graph of the second derivative of a continuous function on the interval (-4,5). The graph of the second derivative is continuous and looks like a quartic polynomial. From left to right, the graph starts above the x-axis and decreases until it crosses the x-axis at x = -2.31. It continues to decrease, then increases until it touches (but does not cross) the x-axis at x = 0. It then decreases, then increases until it crosses the x-axis at x = 3.11, where the graph increases for all x > 3.11. The second derivative is positive at x = -3, equal to zero at x = 0, and positive at x = 4.
Classify all critical points of \(f(x)\) using the above graph of \(f''(x)\) and the following information:
\(f'(x) = 0\) only when \(x=-3\), \(x=0\), and \(x=4\),
\(f''(x) = 0\) only when \(x=-2.31\), \(x=0\), and \(x=3.11\),
\(f'(x)\) and \(f''(x)\) are continuous for all \(x\).
Step 1: Determine the critical points of \(f(x)\).
Since \(f'(x)\) is continuous for all \(x\), and therefore defined for all \(x\), the only critical points of \(f(x)\) occur where \(f'(x) = 0\). And we were specifically told that the derivative is equal to zero only when \(x=-3\), \(x=0\), and \(x=4\), so these are the three critical points of \(f(x)\).
Step 2: Classify the critical point at \(x=-3\).
From the given graph of \(f''(x)\), we can see that \(f''(-3)\) is positive. Therefore, since \(f'(-3)=0\) and \(f''(-3) > 0\), by the Second Derivative Test, \(f\) has a relative minimum at \(x = -3\).
Step 3: Classify the critical point at \(x=0\).
Since \(f'(0)=0\) and \(f''(0) = 0\), the Second Derivative Test is inconclusive and we proceed to using the First Derivative Test:
From the graph of \(f''(x)\), note that \(f''(x) < 0\) for \(x\) just before 0 and \(f''(x) < 0\) for \(x\) just after 0.
This means that \(f'(x)\) is decreasing just before \(x=0\) and decreasing just after \(x=0\).
But since \(f'(0) = 0\), \(f'(x)\) must then be positive just before \(x=0\) and negative just after \(x=0\). A graph of \(f'(x)\) is shown below. Notice how \(f'(x)\) is decreasing just before 0 and decreasing just after 0.
Long Text Description
A graph of the first derivative of f(x) on the interval [-2,2]. The graph starts above the x-axis at x=-2, decreases down to the point (0,0) on the x-axis, and then decreases on the interval (0,-2). The graph of the derivative only crosses the x-axis at the point (0,0) on the interval shown.
In particular, \(f'(x)\) changes from positive to negative at \(x=0\).
Therefore, by the First Derivative Test, \(f\) has a relative maximum at \(x = 0\).
Step 4: Classify the critical point at \(x=4\).
From the given graph of \(f''(x)\), we can see that \(f''(4)\) is positive. Therefore, since \(f'(4)=0\) and \(f''(4) > 0\), by the Second Derivative Test, \(f\) has a relative minimum at \(x = 4\).
More Practice
For more examples of applying the Second Derivative Test, see
Optimization: Using the Second Derivative to Classify Critical Points