
Relative Extrema#
Definitions#
Definition
A function \(f\) has a relative maximum at \(x=c\) if there exists an open interval \((a,b)\) containing \(c\) such that \(f(c) \geq f(x)\) for all \(x\) in \((a,b)\). In this case, \(f(c)\) is called a relative maximum value of \(f\).
Definition
A function \(f\) has a relative minimum at \(x=c\) if there exists an open interval \((a,b)\) containing \(c\) such that \(f(c) \leq f(x)\) for all \(x\) in \((a,b)\). In this case, \(f(c)\) is called a relative minimum value of \(f\).
Example 1#
Relative Extrema
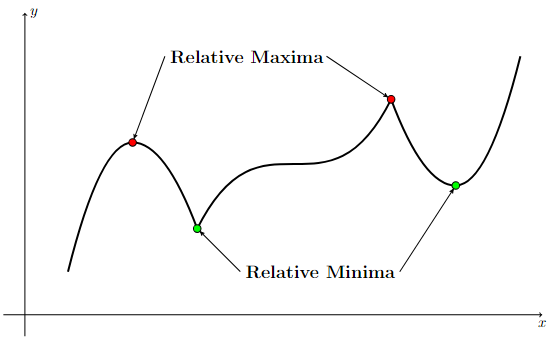
The relative extrema are highlighted on the following graph. Observe how the relative extrema appear at points on the curve where the increasing/decreasing behavior of the function changes. In other words, relative extrema appear at points on the graph of the function where the derivative changes sign.
Long Text Description
There is a horizontal x-axis. There is a vertical y-axis. The graph of a function is plotted on these axes. Moving from left to right, the function goes up towards a rounded corner, which is marked in red and labeled a relative maximum, then goes downward towards a sharp corner, which is marked in green and labeled a relative minimum, then goes up again towards another sharp corner, which is marked in red and labeled a relative maximum, then goes down again towards a rounded corner, which is marked in green and labeled a relative minimum, and then goes upward.
Observation About \(f'\) Where Relative Extrema Appear
The relative extrema of a function appear where \(f'(x)\) changes from positive to negative or from negative to positive. Since \(f'(x)\) changes sign when there is a relative extrema, it must be the case that either \(f'(x)=0\) or \(f'(x)\) does not exist at the relative extrema.
Example 2#
Compare graph of \(f\) and \(f'\)
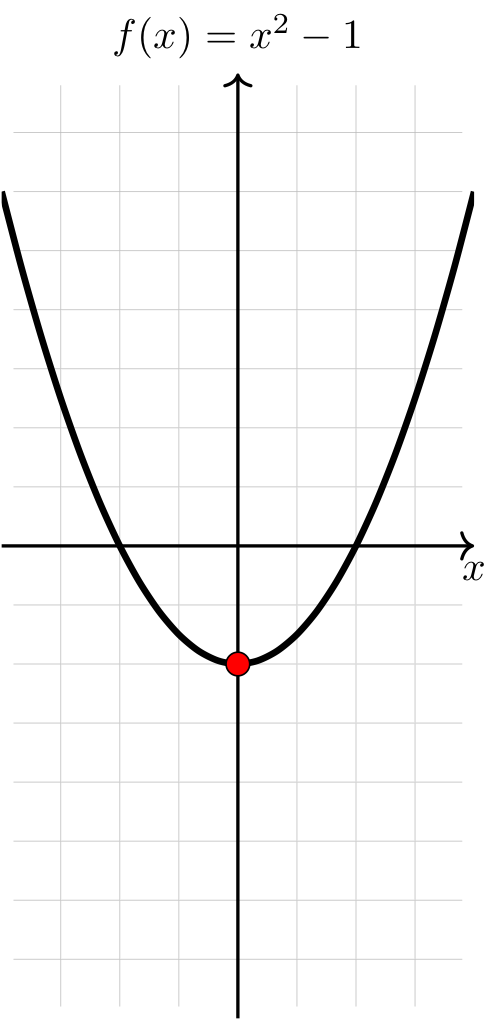
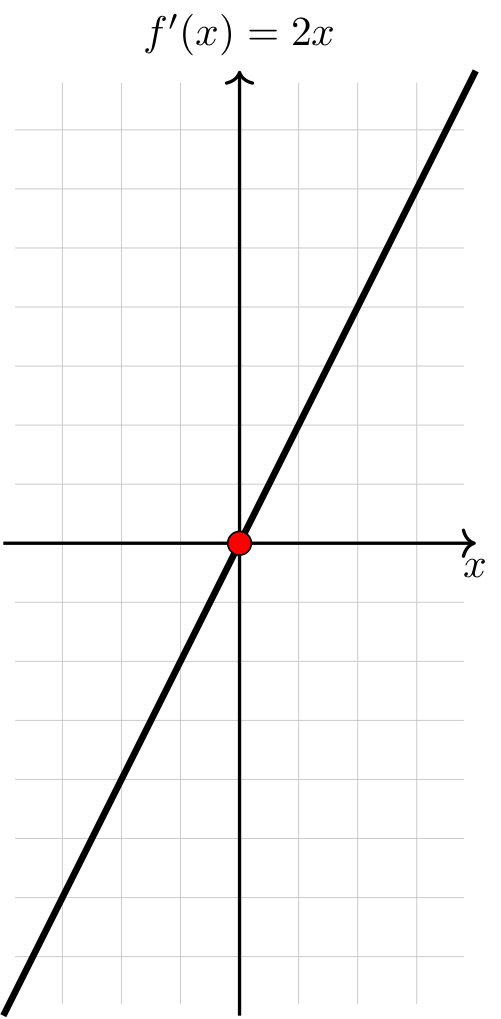
Compare the graphs of \(f(x) = x^2 - 1\) and \(f'(x) = 2x\).
Observe that \(f(x)\) has a relative minimum at \(x=0\), \(f'(0) = 0\), and \(f'(x)\) changes sign (from negative to positive) at \(x=0\).
Long Text Description
There are two sets of axes, in each a horizontal x axis and an unlabeled vertical axis.
On the left, the graph of the function x squared minus one is plotted. The function is concave up along its domain, is decreasing as it comes in from the left to a red dot at its rounded vertex at (0,-1), and increasing to the right of that.
On the right, the graph of it’s derivative two x is plotted. It is linear increasing and passes through a red dot at the origin.
Example 3#
Compare graph of \(f\) and \(f'\)
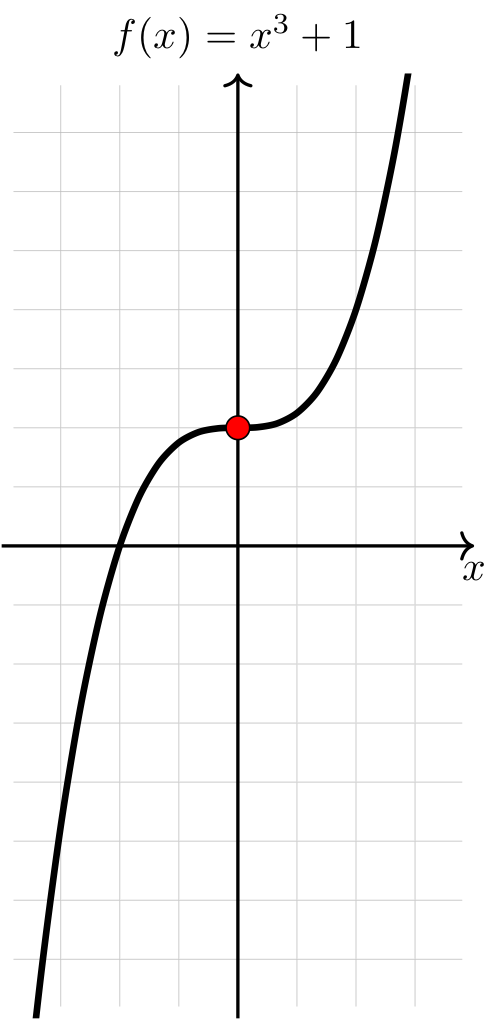
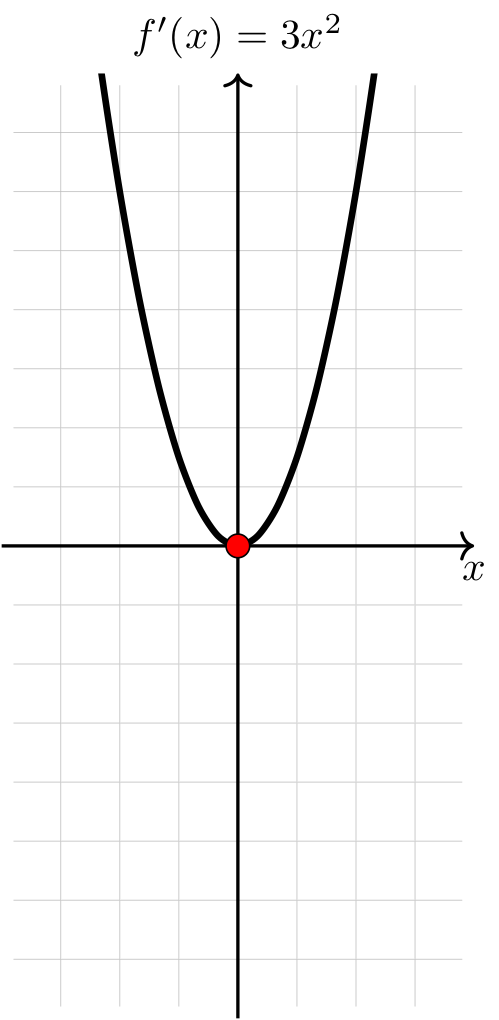
Compare the graphs of \(f(x) = x^3 + 1\) and \(f'(x) = 3x^2\).
Observe that \(f(x)\) does not have any relative extrema despite the fact that \(f'(0) = 0\). Notice that \(f'(x)\) does not change sign at \(x=0\). In other words, in order for a function to have a relative extrema, there must be a change in sign of its derivative.
Long Text Description
There are two sets of axes, in each a horizontal x axis and an unlabeled vertical axis.
On the left, the graph of the function x cubed plus one is plotted. The function is increasing along its domain, is concave down as it comes in from the left to a red dot at a point of flatness at (0,1), and concave up to the right of that.
On the right, the graph of it’s derivative three x squared is plotted. It is a concave up parabola which decreases on the left down to a red dot at its vertex (0,0), and then is increasing after that.