
Differentiability#
Definition#
Definition
The function \(f(x)\) is differentiable at \(x = a\) if the following limit exists.
Intuitively, \(f(x)\) is differentiable at \(x=a\) if we can zoom in on the graph of \(y=f(x)\) at the point \((a,f(a))\) until the graph looks like a single uninterrupted straight line.
Differentiability versus Continuity
If a function is differentiable at \(x=a\), then it is continuous at \(x=a\). This also means that if a function is not continuous at \(x=a\), then it is automatically not differentiable at \(x=a\).
However, if a function is continuous at \(x=a\), then it is not necessarily differentiable at \(x=a\).
Example 1#
Continuous and differentiable
The function defined by the following graph is continuous and differentiable at every point on the graph.
Intuitively, the graph can be drawn without picking up a pencil from the paper (i.e., it’s continuous) and we can zoom in close enough to any point on the graph so that the graph looks like a straight line (i.e., it’s differentiable).

Long Text Description
The graph of a continuous function that increases before x = -1, decreases between x=-1 and x=1, and then increases after x=1. The graph does not have any sharp corners or vertical tangent lines.
Example 2#
Continuous but not differentiable at a point
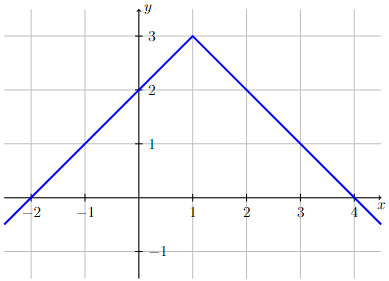
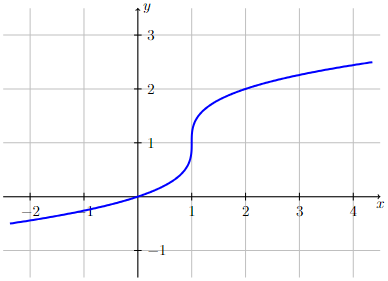
The functions defined by the following two graphs are continuous at every point on the graph (i.e., we can draw both graphs without picking up our pencil). However, both functions are not differentiable at \(x=1\).
For the graph on the left, the function is not differentiable at \(x=1\) since there is a sharp corner on the graph at \(x=1\) (i.e., \(f'(1)\) does not exist). No matter how much we zoom in on the graph at the point \((1,3)\), it will never look like a single straight line. The function is differentiable everywhere else.
For the graph on the right, the function is not differentiable at \(x=1\) since it has a vertical tangent line at \(x=1\) and vertical lines do not have a slope associated with them (i.e., \(f'(1)\) does not exist). The function is differentiable everywhere else.
Long Text Description
There are two graphs displayed. The first graph corresponds to a function that increases linearly with a slope of postive 1 to the point (1,3) where it reaches a corner and then decreases linearly with a slope of -1.
The second graph corresponds to a function that increases from left to right. The curve becomes increaseingly steep as x approaches 1 from the left and ultimately becomes vertical at x = 1. The curve continues to increase for x greater than 1 but flattens out as x increases.
Example 3#
Not continuous and not differentiable at a point
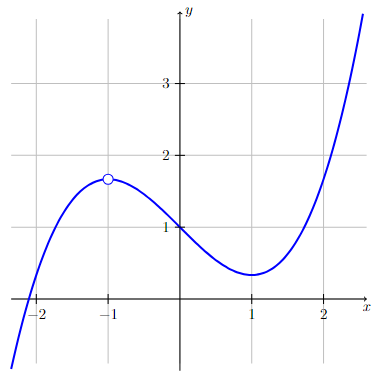
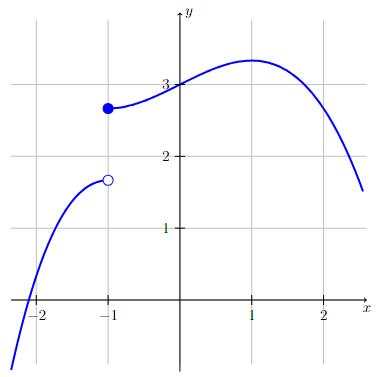
The functions defined by the following graphs are not continuous and not differentiable at \(x=-1\).
For the graph on the left, the function is not defined at \(x=-1\) and therefore is not continuous and not differentiable at \(x=-1\). The function is continuous and differentiable everywhere else.
For the graph on the right, the function has a jump discontinuity at \(x=-1\) (i.e., \(\lim\limits_{x\to-1} f(x)\) does not exist) and therefore is not continuous and not differentiable at \(x=-1\). The function is continuous and differentiable everywhere else.
Long Text Description
There are two graphs displayed. The first graph corresponds to a function that increases for x less than -1, is not defined at x = -1 (indicated by an open circle at the point (-1,1.6)), decreases between x-1 and x=1, and then increases after x = 1. The graph does not have any sharp corners or vertical tangent lines, but has a discontinuity at x = -1.
The second graph corresponds to a function that increases for x less than -1 until it reaches an open circle at the point (-1,1.6). The value of the function then jumps to 2.6, as indicated by a closed circle at the point (-1,2.6). The curve continues to increase from that point, until x = 1, at which point the function decreases.